


The concept of the time value of money is basic to many financial decisions and is a fundamental tool used by corporate executives, investors, borrowers, bankers and financial analysts. Understanding how different investments are affected by time and interest rate changes can help you make better financial decisions.
What Is Time Value of Money? Time value of money is a concept that recognizes the fact that money available at the present time is worth more than the same amount in the future due to its potential earning capacity. This principle states that an amount of money today is worth more than that same amount in the future, as there is more potential for growth and earning down the line. In other words, when given the choice between receiving $100 today versus one year from now, most individuals will choose to receive it immediately.
As a financial concept, time value and money are used to compare investments and be able to make better decisions about where to put their funds. If an investment has a higher rate of return than the opportunity cost (the amount of money an individual would have earned with other alternatives), then it’s probably worth pursuing. In essence, understanding the concept of time value of money allows investors to weigh the costs versus attainable returns in order to make more informed decisions.
In this blog we will understand how to draw a timeline or a time scale. Timeline or time scale is one of the most important tools in time value analysis. Let us look at a time scale to understand its importance. This is a time scale and we represent the time periods as follows:
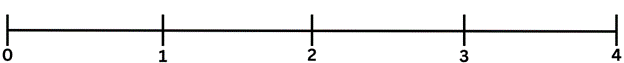
So time 0 is today, time 1 is one period from today. This is one period time, two represents two periods from today. Now these periods can be years, half years, quarters, months etc. So any time period can be represented like this on a time scale.
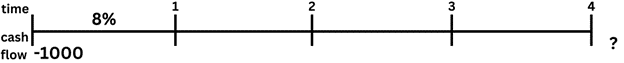
If each period on the time scale represents a year (basically each tick mark represents the end of one period and beginning of the other). Now the cash flows are placed directly below the tick marks and the interest rates are shown directly above the timeline. Unknown cash flows which you are trying to find in the analysis are shown by question mark. I have shown the interest rate and the cash flows on this time scale. Here the interest rate for each of these five periods is eight percent. Lump sum cash outflow is made at time 0 that is today. Now since the initial 1000 rupees is an investment made by you, it is an outflow from your pocket and hence there is a minus sign. This is the amount which you will receive after five years since this will be an inflow into your pocket. It does not have a negative sign or in other words it will have a positive sign. Note that in this timeline no cash flows occur at time periods 1, 2, 3, and 4.
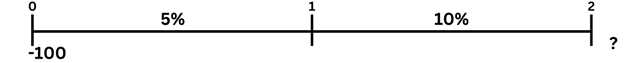
Now consider the following time scale. Here 100 rupees is the cash outflow made today and you will receive an unknown amount at the end of the period. The interest rate is 5% during the first period but it rises to 10% during the second period. So if the interest rate is constant in all periods we show it only in the first period as shown in the first time scale but if it changes we show all the relevant rates on the time scale as shown in the second time scale. So this concept of timeline or time scale comes very handy in visualizing the problems for time value of money and then helps in solving those problems.