


Fundamentals of network diagrams:
One of the main aspects of managing and controlling a project is being able to identify which activities in the project can be done in sequence and which can be done in parallel. Network diagrams make it easy to understand the precedence relationship of activities for complex and large projects.
A network diagram has two main components: activity and event. An activity is the smallest unit of work effort, consuming both time and resources, that the project manager can schedule and control. So this is the smallest unit of work effort, consuming both time and resources. Now these activities are governed by the term precedence relationships. Now, what is the precedence relationship? So the precedence relationship determines the sequence of activities. So it specifies that one activity cannot start until a preceding activity has been completed.
For example, say you want to distribute some brochures for a conference. First, the brochures must be designed, which would be your first activity, and only after that can they be printed, which is your second activity. So you cannot print without the brochures being designed. So this is a precedence relationship between activity A and activity B. Now let us understand what an event is. So an event is the point at which one or more activities are to be completed.
Let us consider the following example: Consider A, B, and C to be three different activities. So an event is the point at which one or more activities are to be completed. Earlier, we had seen that an activity consumes both time and resources, but an event does not consume time or resources.
There are two different approaches which can be used to create a network diagram.
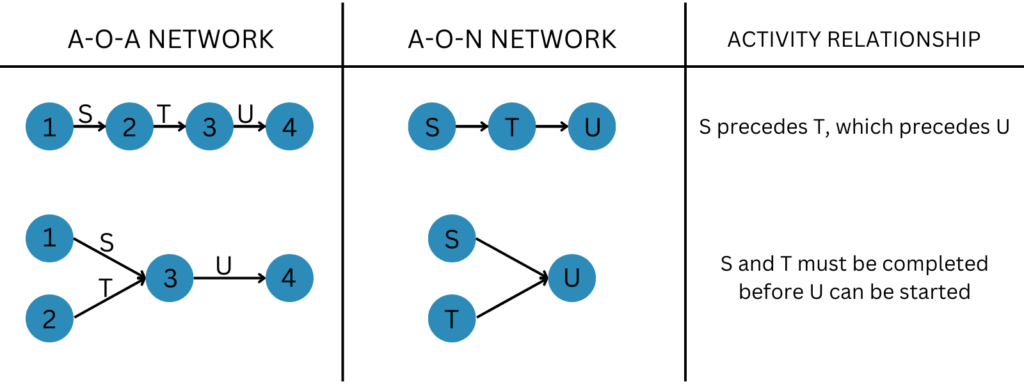
- The first approach is known as the activity on the arc network (AOA). An arc is also known as an arrow, so in this method, the activities are represented as arrows, and nodes or circles are used to represent events. In this case, the circle represents an event, while the arrow represents an activity. In this method, the events are numbered sequentially from left to right.
- The second approach is known as the activity on the node (AON) network. In this method, the nodes represent the activities, and the arrow represents the sequence between these activities. So here, the nodes represent the activities.
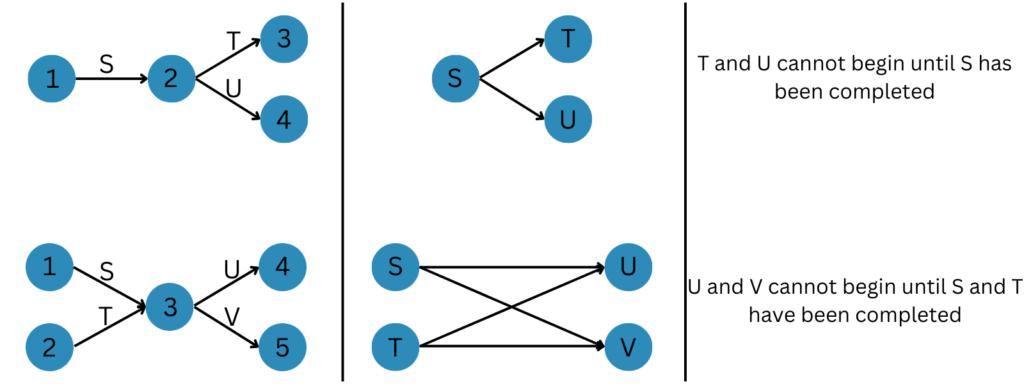
Now let us look at some common examples of how activity relationships can be represented by the AOA and AON approaches.
Let us say we have an activity diagram where S, T, U and V are the activities and 1, 2, 3, 4 and 5 are the events.
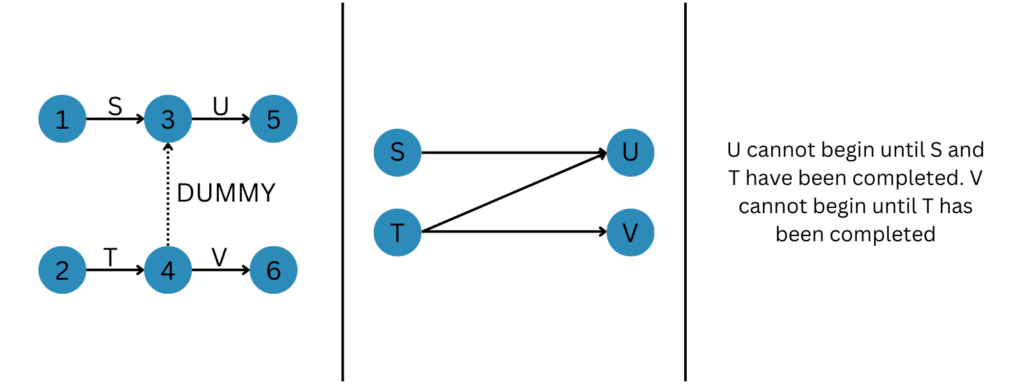
Now, suppose in this diagram you want to represent that U is dependent on both S and T, and V is dependent only on T and not on S. How will you represent it? The previous diagram shows that both U and V are dependent on S and T. But to show that U is dependent on S and T and V is dependent only on T, we need something called a dummy activity. So that diagram will be shown as something like this.